

Tuning a PE3 Fuel Table
EVO Fuel Injection method. Download the data from the ECU, clean the data in this analyzer, paint the fuel table in peMonitor, then shape the surface until it is smooth. Use the Open Graph Window on this app to view the data in the timeline view for clarity. Add or subtract channels in the graph.
The number in each fuel-table cell is base injector open time, in milliseconds. Load (throttle percent open) runs down the left side and RPM runs across the top. The ECU looks up the four cells around the operating point and draws a straight line between them to determine how much fuel to give the engine at that exact parameter. A cliff between two cells becomes a stumble when the engine crosses it. The 3D fuel plot provides a great way to view these cliffs. Its height is open time. Keep it rolling, with no large jumps.
Everything else in the ECU multiplies that base number. Total open time is:
A 2% multiply on a cell is 2% more base fuel. Temperature, accel, and closed-loop factors still stack on top of whatever you type.
The mixture you are tuning to
These are the AFR targets we generally use. Hover over a cell on the fuel-table heat map to see the average AFR in that cell, then compare it with the target for that engine. Move the millisecond number until the color sits on the target and the 3D surface is smooth.
| Engine | Target AFR |
|---|---|
| A-class and U6SA | 12.2 |
| Outlaw | 11.8 – 12.0 |
| Restrictor | 12.2 – 13.2 |
Fuel and AFR move in opposite directions. A lower AFR number needs a larger injector open time. To bring a logged 13.2 down to a target of 12.0, divide the logged AFR by the target: 13.2 / 12.0 = 1.10, which is 10% more fuel. A cell at 3.00 ms becomes 3.30 ms (3.00 × 1.10).
Restrictor engines are picky about how much fuel they want. Start at 12.2 and walk leaner only when the engine asks for it, in small steps. A restrictor engine that is happy at 13.2 will break up at lower air fuel ratios.
1. Load every log
Drop every PE3 CSV from the session onto this page. Files from the same engine configuration combine into one data set. The more hot laps you include, the more of the fuel table will fill in later. To learn how to download the data from the ECU, read this article: https://www.hyperracing.com/Images/Content/PE3-Notes.pdf
2. Apply corrections and filters
Click Apply Corrections & Filters and leave the defaults. They throw out the bad data samples that would lie about the AFR in that cell. You can change the values if needed, but the defaults are good to start with.
- O2 distance 60 inches, exhaust velocity constant 34. That pair is for methanol. Gasoline is closer to 28. The correction slides each AFR sample back to the RPM and load that produced that exhaust, accounting for the time the gas spends traveling to the sensor.
- Coolant minimum 150°F. Cold-start rows drop out.
- TPS rate 80 %/sec. Fast openings and closings drop out. During a throttle stab, the O2 readings will spike and give bad data that will skew the good data. We don't want it in our heat map when we tune.
- Fuel pressure minimum 0. The filter is off. Raise it when you want a starved-fuel moment removed from the log.
- AFR clip 9.7 to 15.5. Sensor spikes outside that window drop out.
- Time trim blank. Fill it in only when you want specific seconds, for example 10-50, 80-120.
Read the filter summary after you apply. You want a solid pile of steady, hot samples left.
3. Glance at the sensor dashboard
A yellow flashing tile is a reading to worry about before you trust the colors on the fuel table. The alarm trips if any sample in the filtered log crosses the limit (crank errors and over-currents are checked on the whole file).
- Battery under 11.8 V or over 17 V
- Air temperature over 120°F
- Coolant under 100°F or over 240°F
- Barometer under 12.5 psi or over 14.9 psi
- Fuel pressure under 50 psi
- Crank errors over 5
- Any injector over-current or coil over-current
Fix the cause, or cut that stretch out with Time Trim and apply the filters again. The fuel-pressure filter can sit at 0 while the dashboard still flashes under 50 psi, so you can see the problem and decide whether those rows belong in the export.
4. Export the cleaned file
Click Export Corrected & Filtered CSV. That is the file peMonitor reads. Transport delay is already applied, and the cold, transient, and spiked rows are already gone.
5. Open the tune file
In the PE3 software, choose File → Import → From Data Acquisition CSV File, then select the exported file from this analyzer. This opens the tune that was in the engine when the data was recorded.
6. Paint the fuel table
In peMonitor open Tuning → Fuel Table (Ctrl+F). Click Setup Tracer and match this window: Enable Tracer on, Drive-2-Tune selected, blue at 9.50, red at 14.50, and a minimum of 5 lambda/AFR averages.
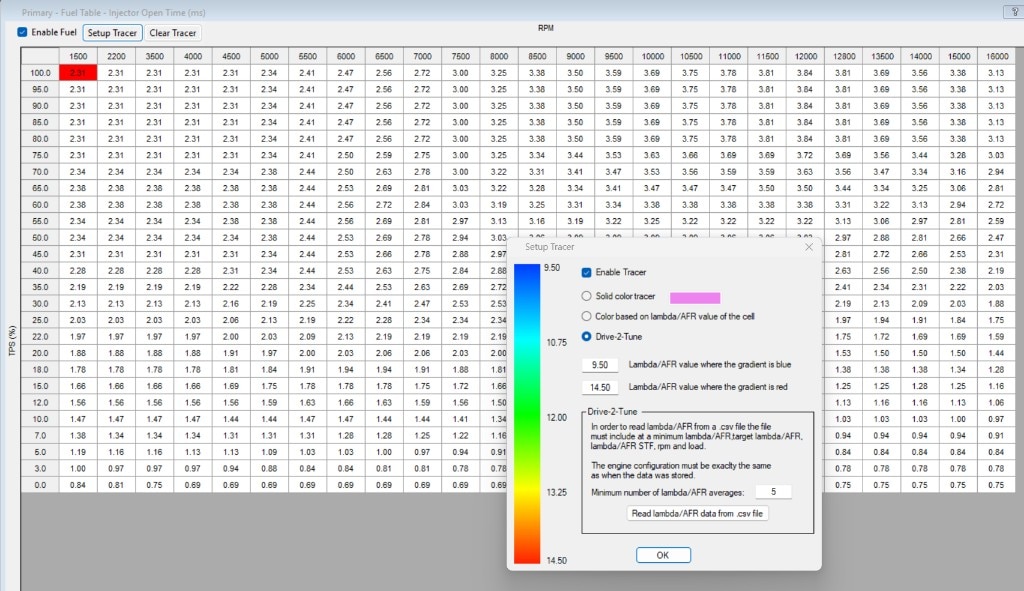
The CSV has to include lambda/AFR, target lambda/AFR, lambda/AFR short-term factor, RPM, and load. The calibration open in peMonitor has to be the same engine configuration that recorded the log, with the same load axis and the same breakpoints. Click Read lambda/AFR data from .csv file and choose the export from this analyzer.
The table fills in as a heat map. The millisecond numbers stay where they are. The color is the averaged measured AFR from the filtered log. A cell with fewer than five good averages stays white. Leave white cells alone until a later session actually drives through them.
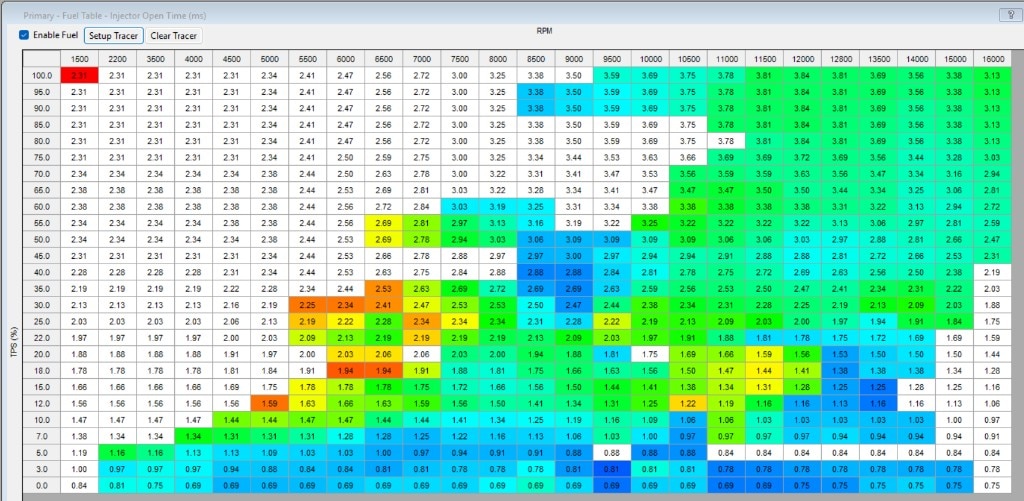
On this scale, 9.50 is blue and 14.50 is red. About 12.0 lands in the green. A-class and U6SA work is aimed at 12.2, so green through that power band is the neighborhood you want. Outlaw is a touch richer, 11.8 to 12.0, still on the green side of this bar. Restrictor targets that climb toward 13.2 move from green toward yellow.
Read a region of neighboring cells together. On the map above, the high-load sites from about 8,000 rpm up are green. The orange and red band near 20% throttle and 6,000–7,000 rpm ran leaner than a 12.2 target, so that pocket wants fuel. The blue along the bottom of the table is richer, down toward the 9.5 end, which is common at very light throttle. Chase it only if the engine actually lives there.
7. Change the table in small steps
Set the math at the top of the fuel table before you touch a cell. The add/subtract box is 0.01. The multiply/divide box is 1.02.
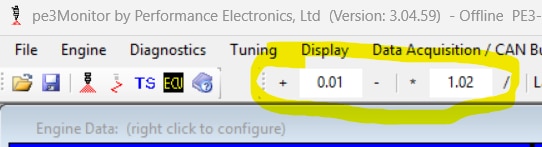
Click a cell, or drag across a block of cells that share a color. Then:
- Ctrl and + adds 0.01 ms
- Ctrl and − subtracts 0.01 ms
- Ctrl and * multiplies by 1.02, about 2% more fuel
- Ctrl and / divides by 1.02, about 2% less fuel
peMonitor lists these as Ctrl+Add, Ctrl+Subtract, Ctrl+Multiply, and Ctrl+Divide. On a laptop they are the matching keys on the number pad. Use multiply and divide when a whole region needs a percentage. Use add and subtract when a cell is already close and you want a tenth of a millisecond. A region whose color has moved from green toward orange and red, leaner than the target for that engine, gets fuel. A region that has moved toward blue, richer than the target, gives a little fuel back.
We recommend making the 80% to 100% values all the same. Tune the 100% row, then highlight that row and copy and paste it onto the 80–95% TPS rows. Then tune and correct the 60% row, then 40%, 20%, and 10%. Highlight the cells between the 60% and 80% rows, right-click, and select Interpolate by Column. That blends those two rows and keeps them smooth. Do the same between the other tuned rows. The low TPS rows, 7, 5, 3, and 0%, need to be tuned individually.
Right-click the table for the same add, subtract, multiply, divide, and smooth commands. Ctrl+Z undoes the last table edit, up to ten steps. With cells highlighted, Ctrl+C and Ctrl+V copy and paste, including into a spreadsheet.
While the ECU is online, the red Table Tracker box is the four cells being interpolated right now, and the blue X inside it shows where the engine sits inside those four. Alt with + − * / changes that red block directly. That is the live path on the stand or in the trailer with the laptop connected.
A number you type takes effect when you press Enter or leave the cell. Online, the PE3 uses it immediately. It stays in the ECU after you save settings.
8. Keep the 3D surface smooth
Open Display → 3D Fuel Plot (Alt+F1) after every change. Rotate with the arrow keys. Zoom with + and −. Page Up and Page Down change the size of the plot. A red X is where the engine is running. A blue circle is the cell under the cursor.
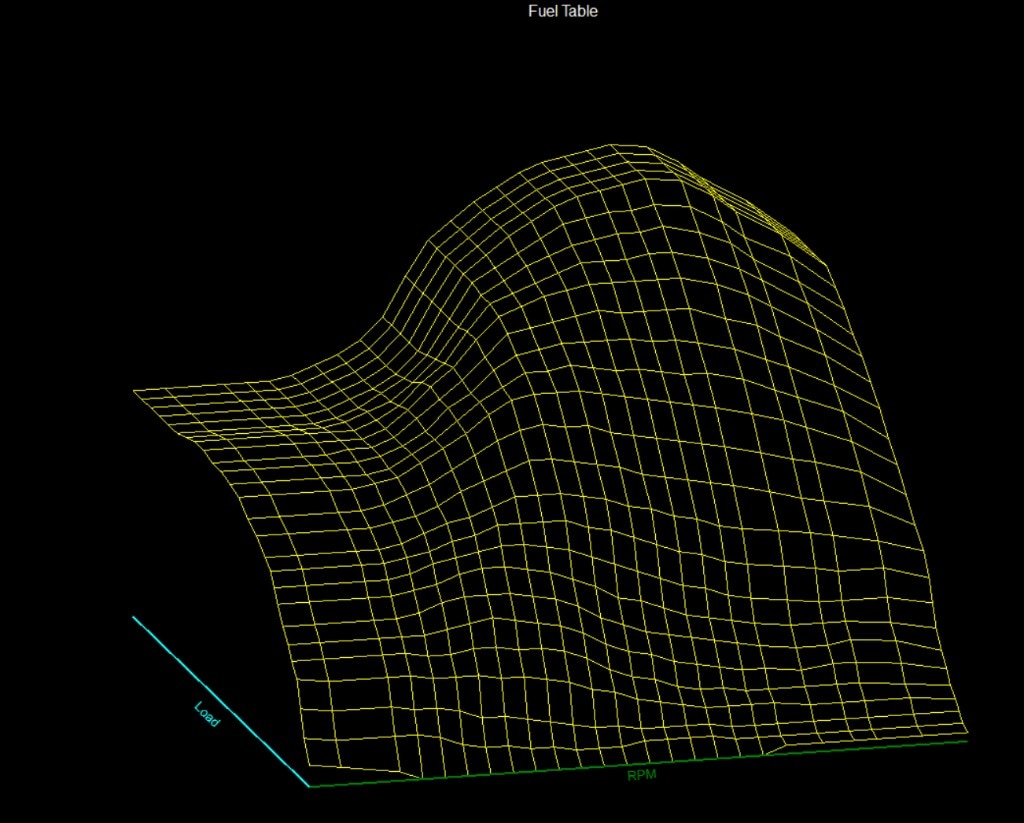
Smooth the surface before you call the map done. Open time should rise as load and RPM rise, and neighboring cells should blend. A sharp peak or a hole is a jump on the Z axis. Fix it even when that one cell’s color looked right. The engine spends most of its time between the breakpoints, on the slope the ECU interpolates, so the slope is the tune.
9. Save the work
Ctrl+S writes a .PED file on the PC so you can go back to this map. Alt+S, or Tuning → Save Settings to ECU, or click Save Settings to ECU in the upper right, writes it into the controller if you are connected live. Until that ECU save, a power cycle can drop the edits you just made. If you are not connected, connect to the ECU so that you have the green Online message in the lower left corner. Connecting calls up the map that is currently in the ECU, regardless of what is on the screen before you connected. Then, once connected, open your saved tuned file and use Alt+S or click Save Settings to ECU in the upper right.
The rest of peMonitor
The shortcuts above are the ones this job uses every session. The full PE3 Series manual, including wiring, closed-loop setup, and every other shortcut, is here:
https://www.hyperracing.com/Images/Content/PE3-series-manual.pdf
- Ctrl+F fuel table
- Alt+F1 3D fuel plot
- Ctrl+Q quick connect to the ECU
- Ctrl+H smooth the highlighted cells
- Ctrl+Z undo the last table edit
- Alt+S save settings to the ECU
- Ctrl+S save the .PED on the PC