SHOCKS: A MYSTERY NO MORE!
Rebound, Compression, Histogram…What Does It All Mean?
If you want to know what shocks to put on your race car, check out our Shock Recommendations. If you want to send a shock in for rebuild or service, use our Shock Service Request Form.
 Hyper Racing has invested thousands of hours collecting on board shock velocity and position data and researching and developing better shock dampening profiles. You have spent an equal amount of time building, maintaining, and caring for your adrenaline fix in the garage. You owe it to yourself to understand one of the largest influences on the behavior of your car. We can sell you the right shocks, and we can teach you how and when to adjust or change them so you can travel in the lane you most want to travel…victory lane!
With our Motec data acquisition system and through applying advanced vehicle dynamics formulas in the Motec software, we know exactly where and when the shocks are regulating massive amounts of weight. The importance of shocks cannot be overstated.
Shock Lab
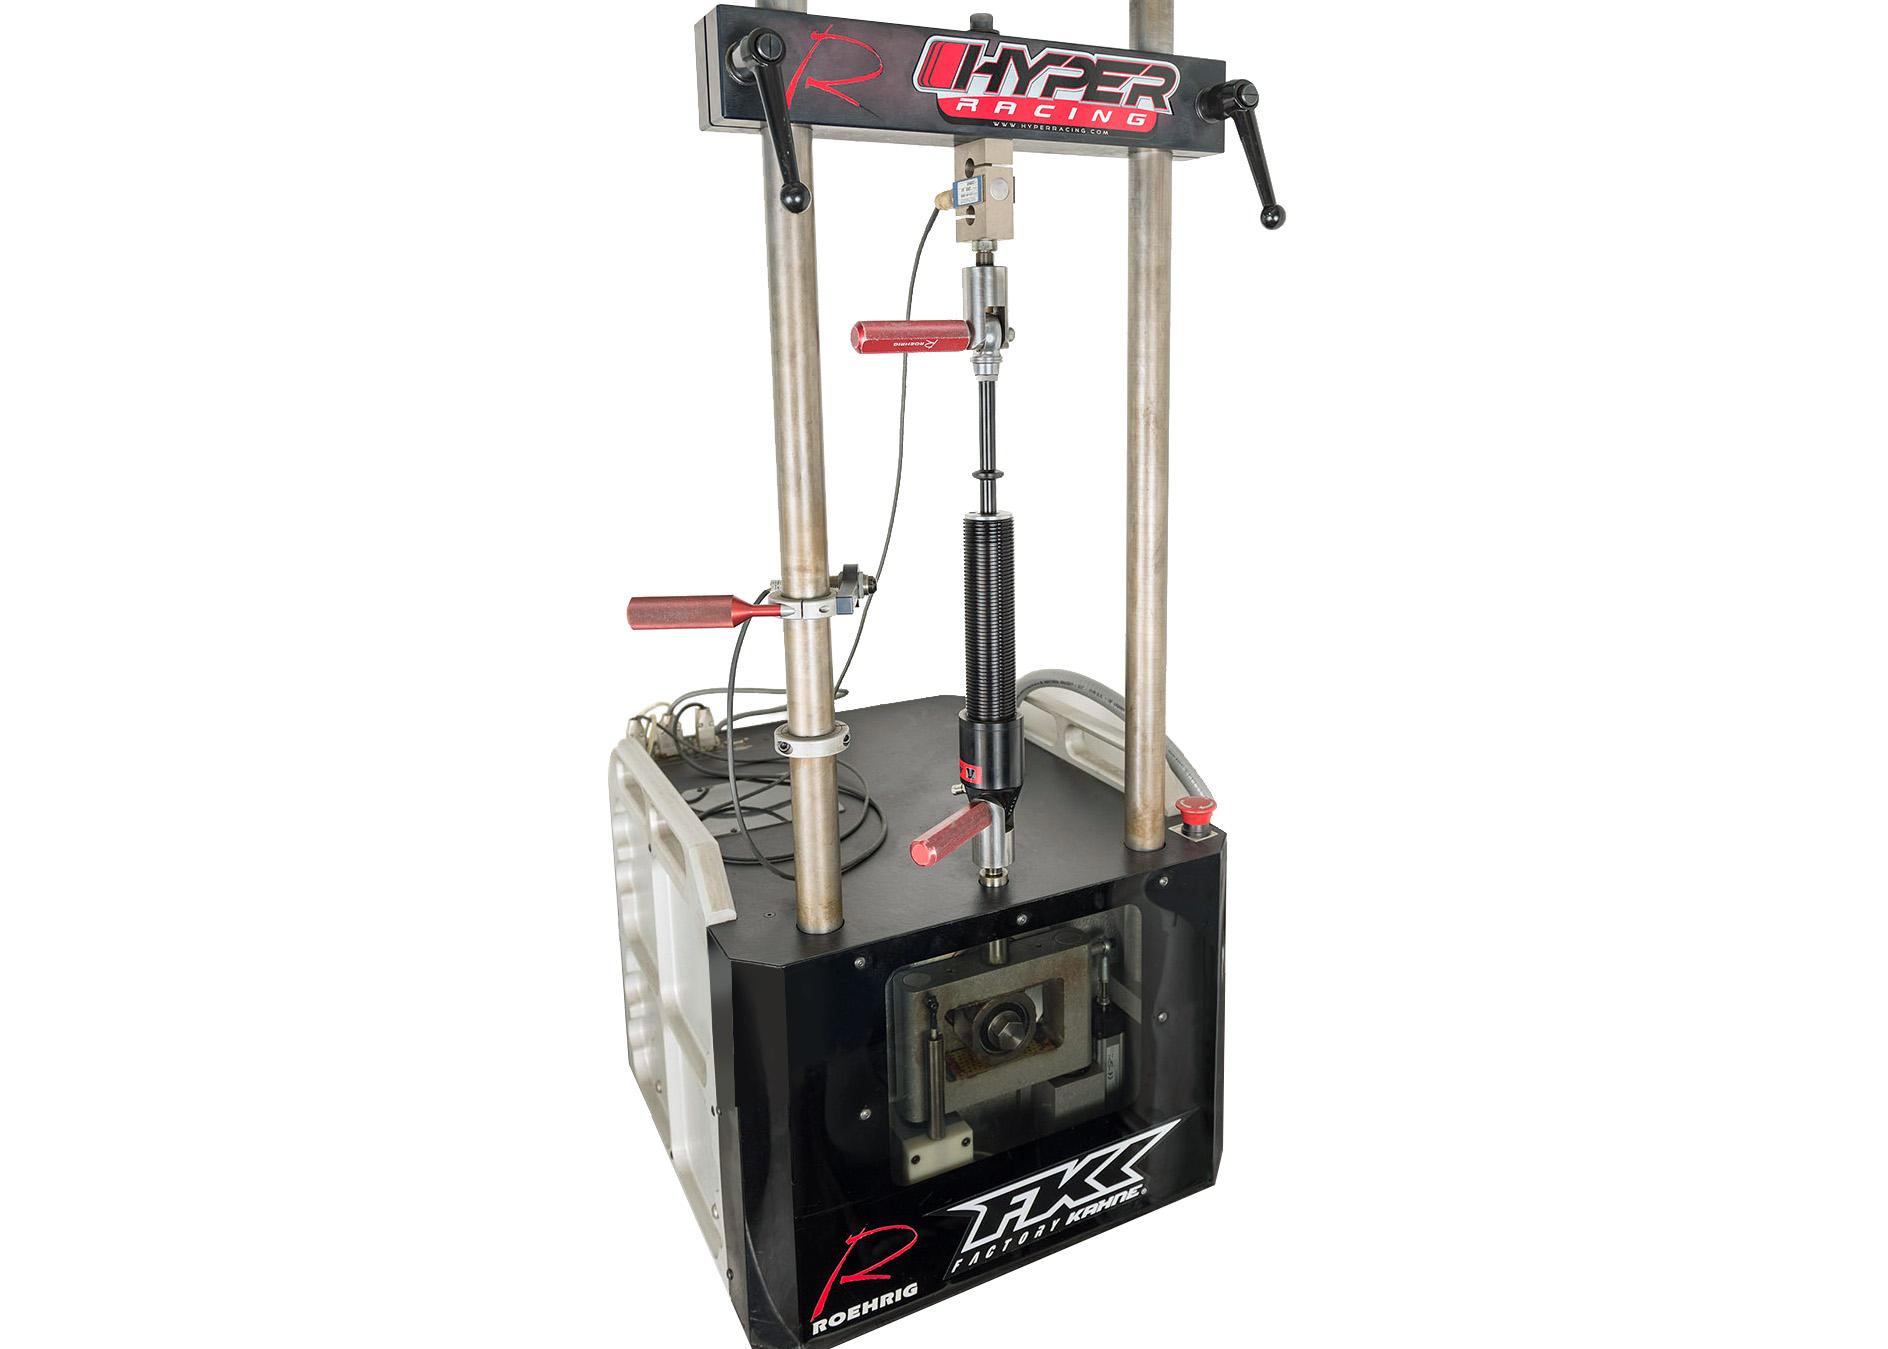
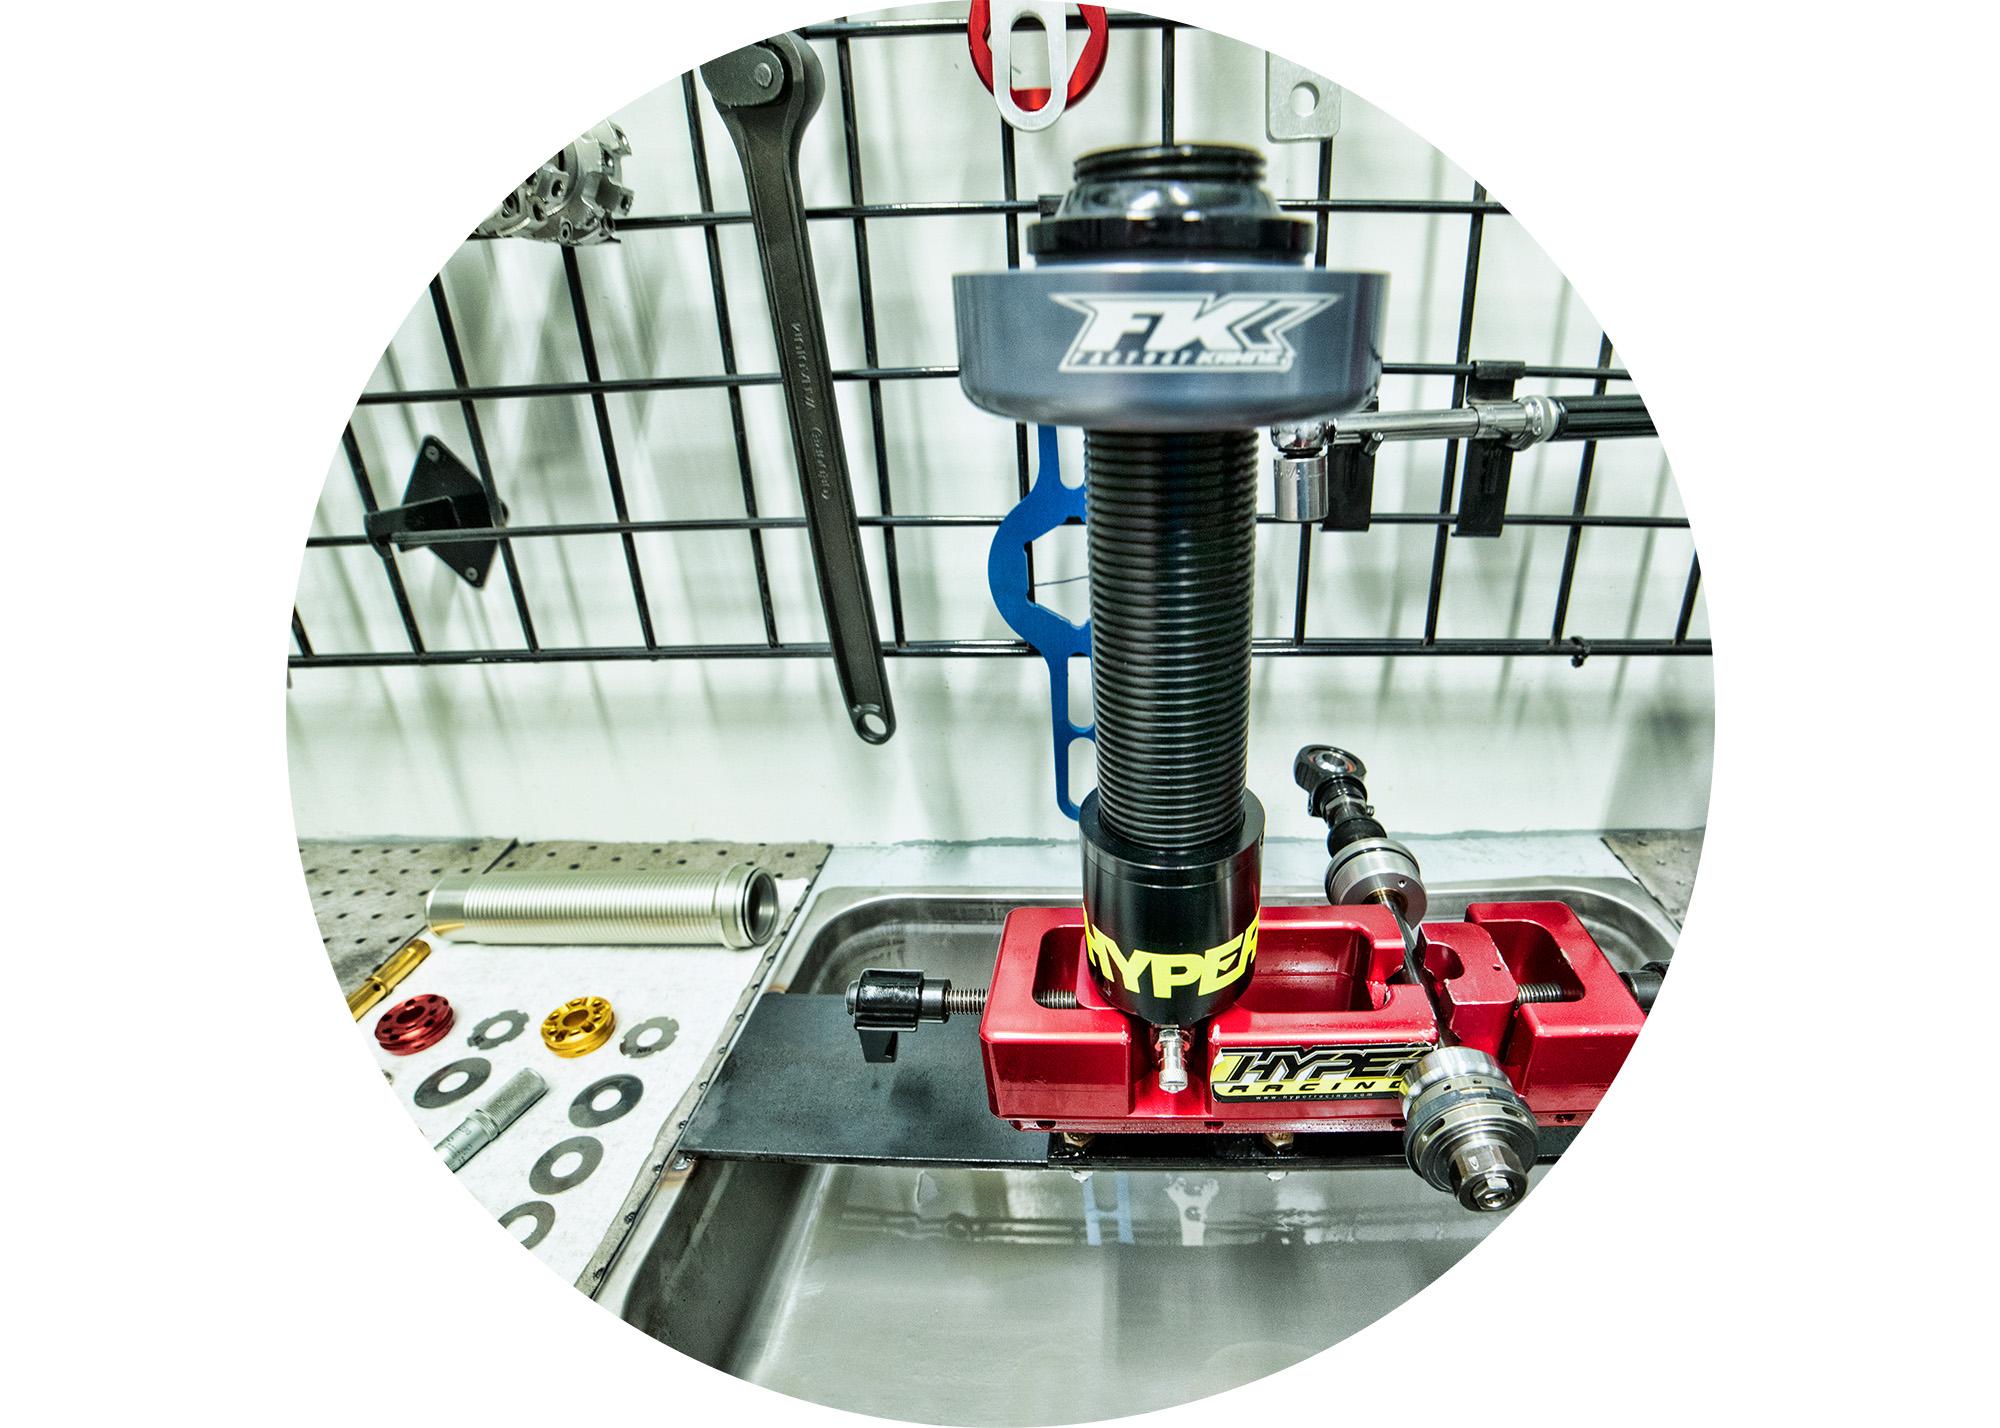
Hyper Racing’s Shock Lab will come to the rescue! A run on the Roehrig Shock Dyno can detect malfunctioning shocks, identify problems with chassis handling, plot rebound and compression dampening curves, and compare your shock to a standard shock of the same valving. If a problem is found, or if you just wish to revalve, we will service the shock in-house. Our technicians have received certification training to rebuild ARS, FK, AFCO and CSI Shocks.
What Is The Purpose Of A Shock?
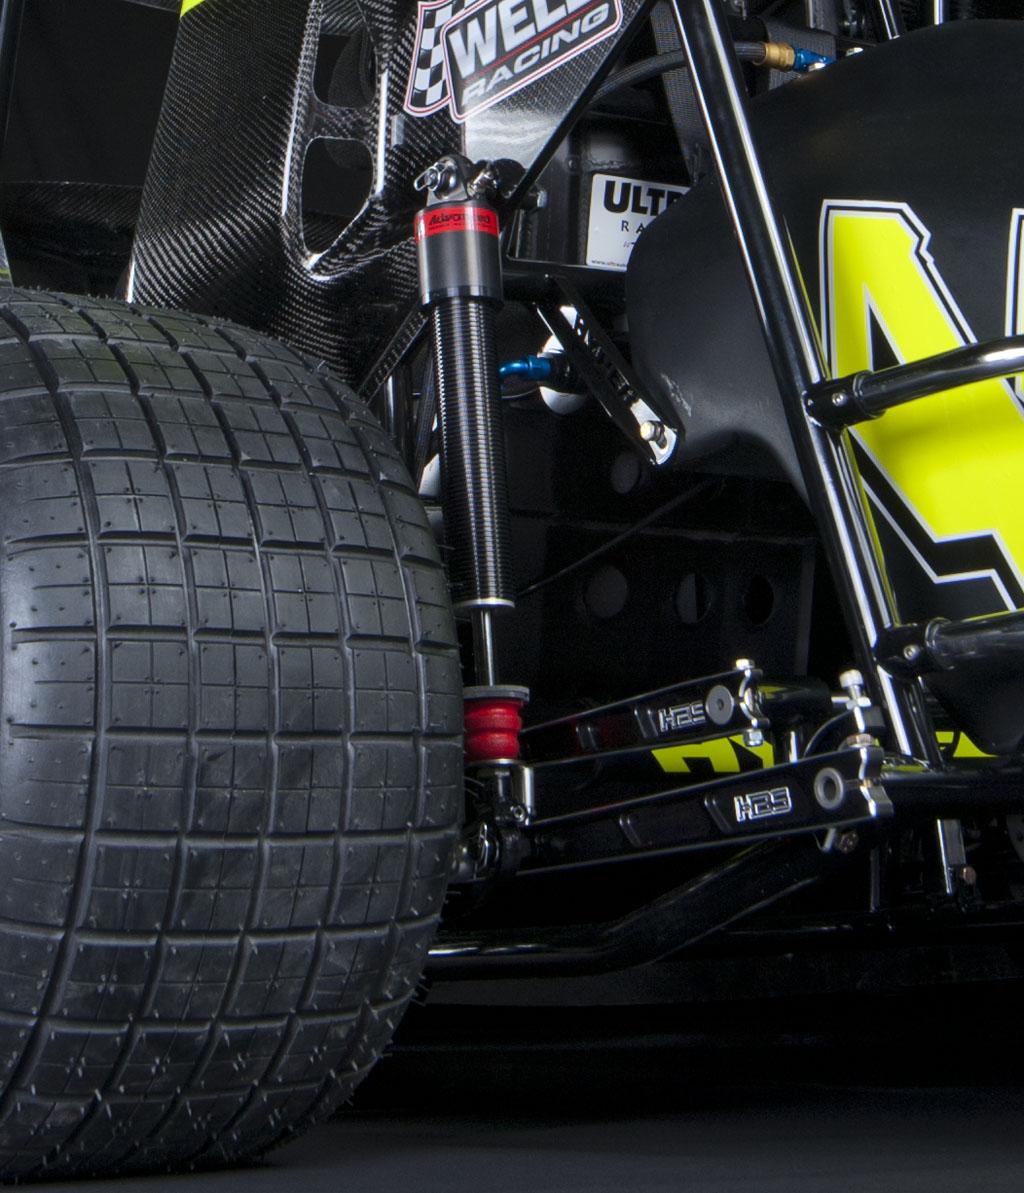
One purpose of the shocks and springs is to make the chassis stable and predictable while driving over bumps or ruts. If the shock/spring combination is too stiff, the tire can be pulled off the track surface for a period of time, eliminating that tire's traction ability. If the shock/spring combination is too soft, the chassis can bottom out on the track, again hindering traction. This loss of traction in both scenarios can cause the chassis to skate and make it unpredictable and difficult to drive.
A second purpose of shocks and springs is to control the amount of understeer and oversteer (tightness and looseness) present in a chassis at particular parts of the track. While springs have an effect on the amount of weight on a corner and the ride heights of the car in the static state (sitting still), their contribution in the dynamic state is limited. This second purpose is where we need to spend some time…read on.
Shock Terminology
“Dampening” or “damping” means “to depress, reduce or lessen.” These terms can be used interchangeably. A shock reduces the amplitude of the wave the chassis creates after it hits a bump in the track. If a car had no shocks, it would oscillate for a long time.
Compression is when the shock gets shorter; rebound is when the shock gets longer. For example, when the front bumper is depressed, compression occurs, when it is released, the shocks rebound.
Velocity of a shock is the speed at which it is compressing or rebounding. Velocity is usually referred to in terms of inches per second or inches/second. Shocks have different dampening forces at different velocities.
Shock Dyno Graph
The dampening forces of shocks at different velocities may be analyzed on a shock dyno. Hyper’s Roehrig shock dynamometer is the best in the business. The dyno has a load cell at the top that very accurately measures the forces of the shock as a servo motor turns a crank that oscillates the shock. The servo motor can spin very accurately at different speeds enabling recording of the forces at high and low velocities. A graph of these forces, known as a velocity vs. force graph, can be created. There are other graphs that can be viewed, but this is the most common.
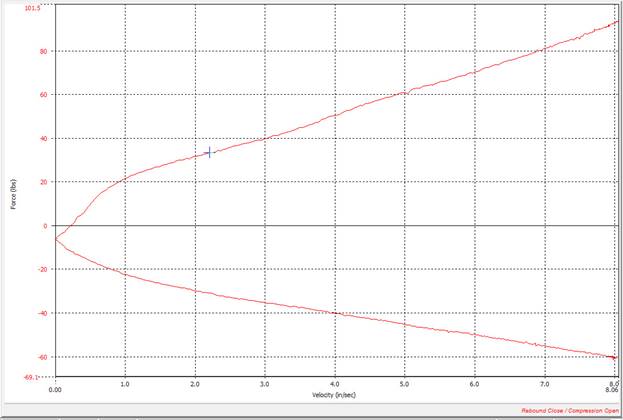
Figure 1: This graph shows velocity in inches per second on the X axis (horizontal) and force in pounds on the Y axis (vertical). The negative numbers (lower part of the graph) appear when the shock is in rebound, and the positive numbers are compression.

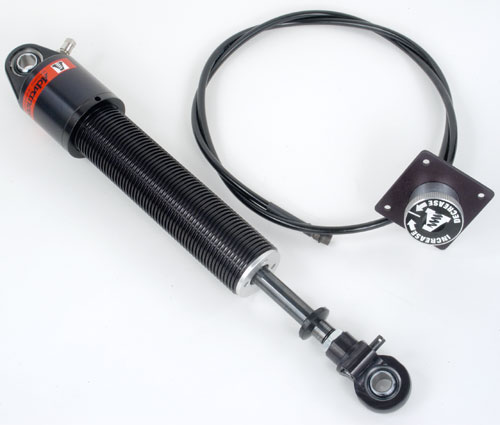
Figure 2: The multiple lines on the negative side of Figure 2 represent each turn of the shock adjuster of this adjustable rebound or “tie down” shock. In this case each line represents one turn change on the shock adjuster knob.
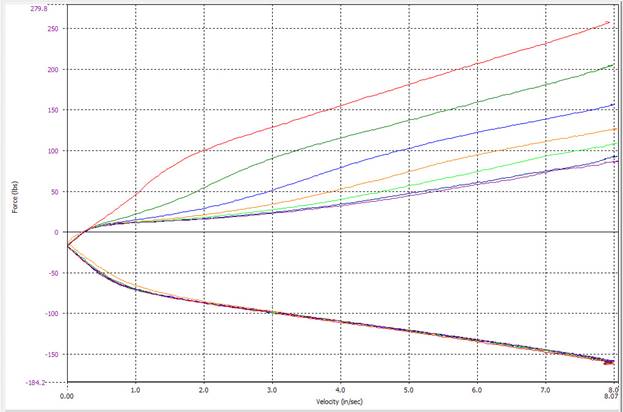
Figure 3: This is an adjustable compression shock.
Be careful when reading a shock dyno graph, since not all software will print the graphs the same. Some shock builders prefer the rebound side of the graph to be on the top and the compression on the bottom. (This is the way ARS prints out their graphs.) Hyper Racing on the other hand, prints them out as you see here, with the rebound on the bottom. It really makes no difference. Just look for the negative numbers and that is the rebound side. Engineers are taught that the negative numbers run down the page and positive numbers go up the page, so this just looks right to me.
Pay attention to the scale of the graph, since the scale can make the graph look completely different. Notice the highest velocity (X scale, notations running along the bottom of the page) and the highest force (Y scale, the notations going up the side of the page).
Shock Number Rating System
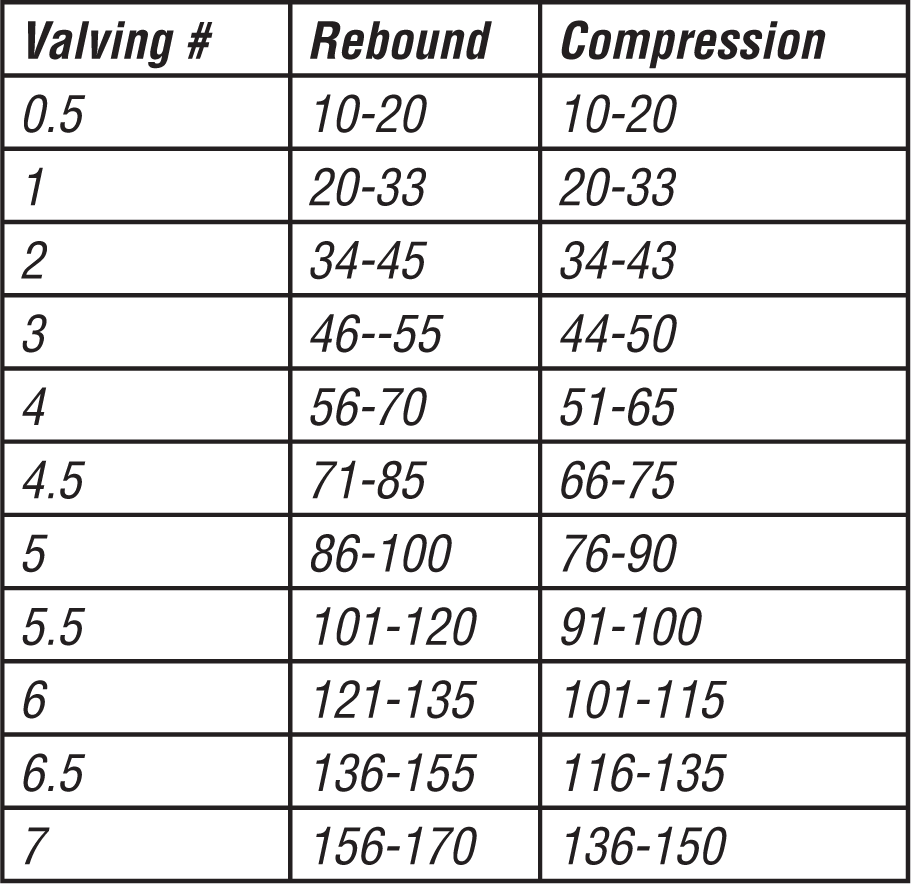
Almost all shock companies use the force dampening at 3 inches/second velocity to rate their shocks and to apply a valving number to that shock.
Below is a chart that Advanced Racing Suspensions (ARS) uses to rate their shocks. It gives a general idea of what forces a particular shock will yield at 3 inches/second. It should only be used as a guideline.
The adjustable compression shock graph in Figure 3 is a 5/6.5-1, which is a 5 rebound with a 6.5 to 1 adjustable compression valved shock.
The shock valving number only describes the 3 inches/second number and nothing else. This number really has to be taken with a grain of salt because it totally ignores everything else about the shock dampening curve. It is a simple, easy to understand way of describing a shock.
Weight Transfer Due to Shock Force
To understand how the shocks affect car handling, read the article called Rethink Dirt: Advanced Dirt Track Theory.
How do rebound and compression damping forces influence the amount of weight on a corner? Every time the car moves as a result of a bump, wing force, or G force from lateral or longitudinal acceleration, the shock will influence the weight transfer on that corner of the car. In almost all cases the force from the shocks is much greater than the force from the spring and it will control more weight than the static weight.
If we add more rebound damping force to a shock on a particular corner of a car it will cause that corner of the car to have less weight on it when that shock is in the rebound state.
Conversely, if we reduce rebound it will place more weight on that corner when in rebound. This is fact and is documented in every notable shock book. Yes, this means when you add rebound damping force to your left rear shock, it is going to give the car less left rear weight.
Think in corners, here. For example, when adding rebound to the left front, add left rear-right front weight when the left front shock is in the rebound state. This will tighten the car in the lateral considerations, but may loosen the car for longitudinal acceleration due to the fact that it is going to keep the CGH lower. Go through these thought processes when making a change. It is rarely straightforward, one change will have many consequences.
More compression damping force of a shock will cause that corner of the car to have more weight on it while that corner is in the compression state. Less compression will place less weight on that corner when it is in compression.
Use this knowledge along with knowing how the car moves through a turn in the winged down phase and the roll right phase to figure out how the shocks are influencing the car's ride height and corner weight. Remember, it is only the center of gravity height (CGH) and tire loading, (trying to keep the weight equal on the rear tires), that is being affected here. All adjustments come down to this.
The shock dyno graphs show that the faster a shock is moving the more force it is applying. Hyper Racing's extensive real world testing with data acquisition units that sample the shock's position 1000 times per second, shows that shocks contribute a lot more to the corners weight when in motion than turns in a torsion bar stop or coil over adjuster nut.
For example: If Figure 2 is the graph of the left rear shock and the shock potentiometer shows that it is moving out (rebounding) at 2 inches/second at a particular part of the turn. The adjustment is set at full stiff (6 valving). The shock graph shows that the left rear corner of the car now has 150 pounds less weight on it than it did when the car was at rest. If the shock had been set at full soft (2), it would have only 30 pounds less weight on it. That is a 120 pound difference in weight. Considering that one turn on the torsion bar on the left rear would only change that corner's weight by about 5 pounds. This is a pretty large change.
Data Acquisition
The Motec SDL3 data acquisition system with shock potentiometers has been used extensively by Mike Dicely at Hyper Racing for shock research and development. These shock sensors measure the position of the shock up to 1000 times per second. It also measures the lateral, longitudinal, and vertical G forces, speed, GPS track mapping, steering position, and yaw rate. In addition, the Motec SDL3 has many engine sensors that have nothing to do with suspension or our discussion here.
The real power of the Motec system is in its i2 Pro software. Without the software all you have is a bunch of numbers. The software allows you to plot graphs, create math calculation channels based on sensor data, look at the line you drove around the track, and lots of other really cool stuff.
At first, Mike just collected data, asked a lot of questions, read a lot of books, and consulted some really smart race engineers. These engineers, who collect, analyze and solve high end asphalt race car data problems for a living, were amazed and curious at the data that came off of winged dirt cars. It was something they had never seen before and it challenged them to think differently than they normally do. The huge top wings and yaw angle (the angle through the turn) are unique in the racing world.
Real Life Shock Velocities
With a data system and shock sensors we are able to record real life on-track shock position and use it to write a math channel to calculate the velocities of the shocks by taking the derivative of the position over time. All velocities in this paper are represented in inches per second (inches/second). Here is a graph from the i2 software showing each corner and its shock velocity.
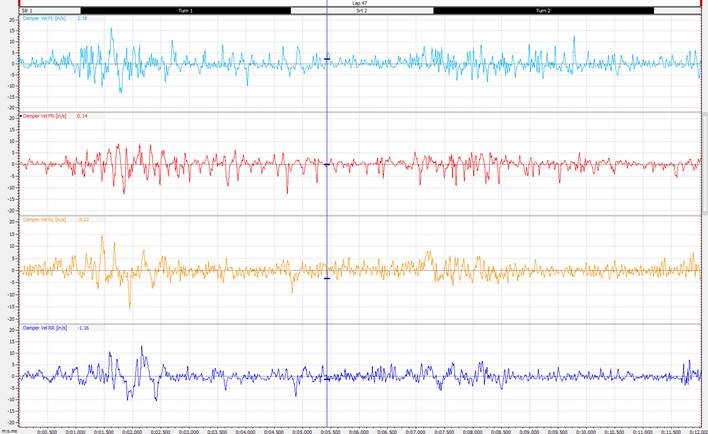
Figure 4: Toward the left of the Figure 4 graph where the velocities are reaching some high numbers is during corner entry. This is a very transitional stage and the shocks contribute significantly in this phase of the turn. This particular data is from a really smooth 1/4 mile track.
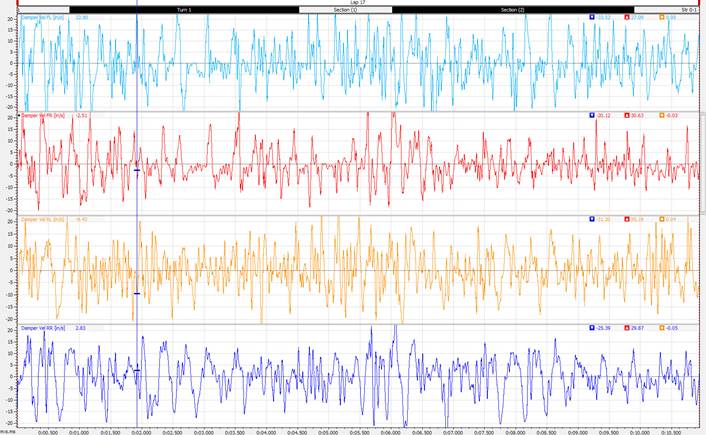
Figure 5: The above Figure 5 graph is from a 1/6 mile rougher track. Note the difference in velocities. On the right it shows each corner's max velocity achieved in compression and rebound during this one lap. Numbers have been seen in the 40’s.
Shock Histograms
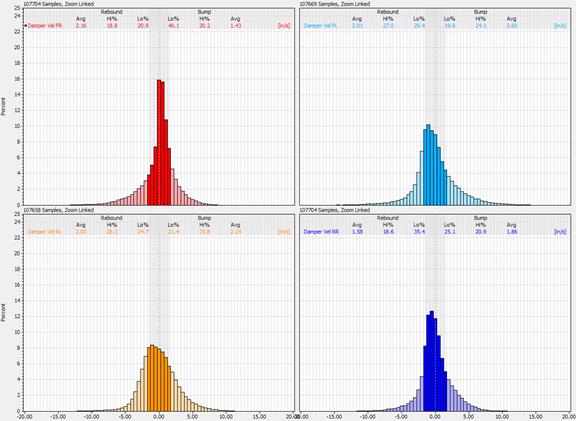
Figure 6: Smooth Track Histogram
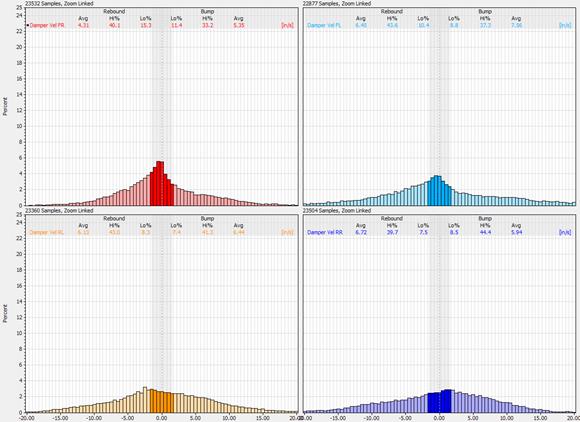
Figure 7: Rough Track Histogram
A shock histogram shows the percentage of time the shock spends at each velocity (a history of its velocity on paper…histogram…kind of funny). Velocity is across the bottom, and percentage is on the left. Figure 6 is from a smooth slick track. When the shocks are valved incorrectly the histogram looks radically different and does not have the preferred normal distribution and bell shaped curve you see in this diagram.
The histogram has a light gray vertical area at 1-1/2 inches/second. This is called the low speed boundary. The low speed is what the driver feels and the high speed is what affects the chassis when it hits a bump. On asphalt, 1 inches/second or even 1/2 is used for low speed boundaries. On dirt this is too low and 1-1/2 or 2 is a better number to use. This is due to the roughness of the track and the fact that shocks are tuned many times for platform control (chassis attitude or the car's position). Since the car is racing in a circle and symmetry is not needed in our setup, the car is offset to the right.
The top histogram is from a slick track and the shock had more compression in the right front (FR), more rebound in the left front (FL) and low compression in the right rear. Look at the low speed % time. Note the use of "FR" for right front because that is how the Motec graph and F1 race engineers reference it. Most likely, that notation started in Europe where their language puts the noun first, then the verb. “The yellow car” becomes “the car yellow”.
A majority of the shock's time is spent in the 1 and 2 inches/second and these parts of the shock dyno graph are most important for what the driver feels. The percent of time the shock spends in rebound and compression above and below the low speed boundary is shown on the graphs across the top of each corner of the car. The high velocities (6 to 40 inches/second) are mainly achieved when the chassis hits bumps. Observing the velocity plot shows that on corner entry, the LF and LR see some pretty high numbers due to the winged down effect. This effect is much higher on slick tracks than on wet tracks.
When we change the valving on the shocks, the histograms change significantly. Many hours have been spent revalving shocks to get the histograms to look the way they do in these graphs. With previous shocks, the histogram of the front shock looked flat, since the low speed valving was way off.
Histograms are what all the advanced asphalt teams look to when they tune their shocks. This in combination with driver input are what is used to achieve the lowest lap times.
Shock Position
A plot of each corner's shock position is very useful to look at as it shows how the car is moving and when each shock is generally in compression or rebound. Before we look at these graphs, realize that, we race on dirt where conditions change all the time, we race on many different shaped tracks, the amount of traction in the track can be drastically different from top to bottom, we sometimes bounce off curbs and berms, and each driver has his own style. These variables lead to position graphs that make it very hard to derive any generalizations. I have spent countless hours staring at these position graphs trying to come to some sort of true statements that I can make about what ours cars do and when.
Here are some generalizations that can be made (with wings on).
Winged Down:
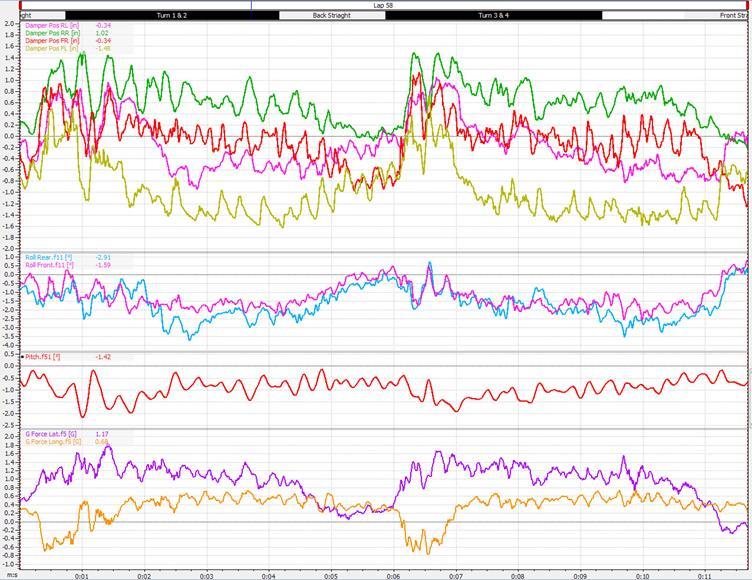
Figure 8: Position data from an 1/8 mile track.
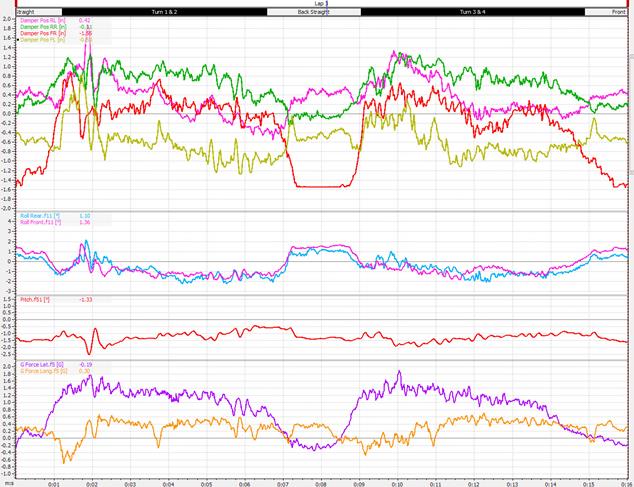
Figure 9: Data from a 1/3 mile track with tight turns and a long straightaway.
The top 4 lines are the positions of the 4 shocks. Green is the RR, Pink RL, Red FR, and Gold FL. The next group of lines down shows the lateral roll angle of the car. As the car rolls right, the line moves down. The roll angle is a simple math channel written based on the shock position and a few known static measurements. The next line down is the pitch (front to back roll). The lower the line the more rolled to the rear the car is. The bottom group is the g-force, lateral and longitudinal.
Figure 9 shows how much the car rolls left on the bigger track, and for how much longer. It wings left so much that the right front shock is topped out.
Using the shock dyno graph, shock position, g-forces, many static measurements, and formulas, math channels can be written to calculate the weight on each wheel as the car takes a lap. It’s pretty amazing and revealing.
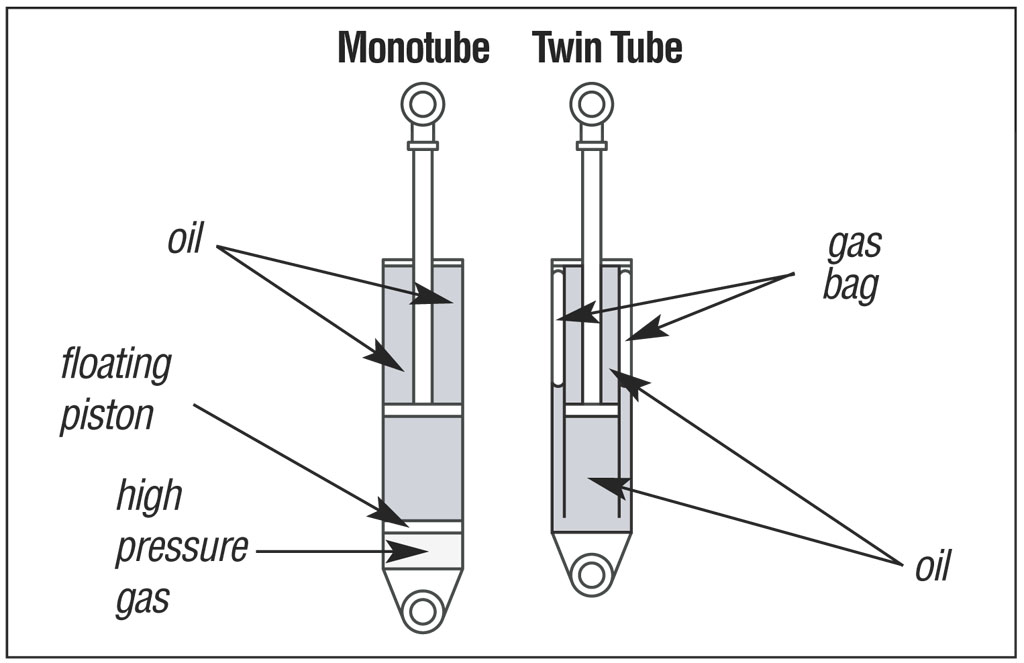
Monotube Vs. Twintube
Monotube shocks are also incorrectly known as gas shocks. Both monotube and twin tube shocks use gas pressure. Monotube shocks use high pressure gas (nitrogen) on the opposite side of a floating piston to keep a constant pressure and volume of oil in the shock body as the shaft adds and subtracts volume when the shock oscillates. Twin tube shocks use a lower pressure gas in a bag to achieve the same result. Monotube shocks have an advantage of control, since their larger pistons displace more oil for a given stroke. This is especially true for the rebound stroke. The greater the amount of oil moving through a shock's piston, the easier it becomes to regulate the flow and thus control the damping forces of the shock. Although fading is generally not a problem for micro sprints, monotube shocks also will not fade due to heat. They stay cooler because the piston and oil are in direct contact with the outside wall of the cylinder allowing for better dissipation of heat. Monotube shocks also last longer because they have less moving parts to wear out.
The nitrogen gas pressure in a monotube shock is required at all times for it to function properly. 2009 and newer style ARS shocks with the S designation after the shock number require very little gas pressure. The gas pressure can be adjusted to suit various track conditions. Changing gas pressure affects the car in a manner that is like increasing ride height or adding turns to that corner. It is not at all like going to a stiffer spring rate/torsion bar size. You can think of it as though adding 80 psi is like adding 10 pounds to that corner, or like adding two turns on that torsion bar. I have done tests and, at least on the ARS shocks, adding gas pressure does not make a spring rate type change, it only adds rod pressure.
Less pressure on the right rear shock will tighten the car in the middle of the corner. Increasing the pressure right front or left rear shocks will provide more cross weight (RF + LR) to the car providing more bite in the middle and out. Adding pressure to all the shocks equally will raise the whole car, raising the center of gravity which will provide more forward bite.
Setting Gas Pressures
The pressure in the ARS monotube shocks can be adjusted from 10 psi to 100 psi. To start, set the front shocks at 20 psi and the rear shocks at 10 psi.
Advanced Racing Suspensions (ARS) shocks contain the highest quality components for maximum performance. Hyper Racing is the world’s largest distributor of ARS Shocks. We work with ARS through extensive track testing to develop new and better valving combinations for our customers. Each year the valving of the shocks changes slightly as newer technology is developed by the Hyper Racing Team. Please check the setup pages to view the latest shock valving recommendations.
Building a Quality Shock
ARS dynos every shock built and allows no overlap in valving numbers, maintaining the tightest tolerances in the industry. ARS removes all air and pressurizes the shock properly avoiding cavitation. Each twintube valve is individually flow tested to ensure consistent dampening. The 3200 ARS series (mono tube) shock utilizes a base valve installed between the floating piston and the valving piston to isolate the pressure, allowing for substantial reduction in rod pressure. Maximum traction is obtained because pressure build up is dramatically reduced with the use of the low rod pressure. The base valve design requires so little gas pressure that certain valvings have only 3 lbs. of rod pressure. This low rod pressure creates more driver feel which is lost in many high pressure shocks. The 3200 series shock will accept gas pressure from 10 lbs. to 100 lbs. which provides for fine tuning the chassis balance with gas pressure. The latest base valve designs have a feature that helps to eliminate hysteresis. Hysteresis is the residual forces in the shock as it changes direction. The bottom line is it really helps shocks control the car on a rough track.
Hyper Racing has invested thousands of hours collecting on board shock velocity and position data and researching and developing better shock dampening profiles. You have spent an equal amount of time building, maintaining, and caring for your adrenaline fix in the garage. You owe it to yourself to understand one of the largest influences on the behavior of your car. We can sell you the right shocks, and we can teach you how and when to adjust or change them so you can travel in the lane you most want to travel…victory lane! With our Motec data acquisition system and through applying advanced vehicle dynamics formulas in the Motec software, we know exactly where and when the shocks are regulating massive amounts of weight. The importance of shocks cannot be overstated.
Shock Lab
Hyper Racing’s Shock Lab will come to the rescue! A run on the Roehrig Shock Dyno can detect malfunctioning shocks, identify problems with chassis handling, plot rebound and compression dampening curves, and compare your shock to a standard shock of the same valving. If a problem is found, or if you just wish to revalve, we will service the shock in-house. Our technicians have received certification training to rebuild ARS, FK, AFCO and CSI Shocks.
What Is The Purpose Of A Shock?
One purpose of the shocks and springs is to make the chassis stable and predictable while driving over bumps or ruts. If the shock/spring combination is too stiff, the tire can be pulled off the track surface for a period of time, eliminating that tire's traction ability. If the shock/spring combination is too soft, the chassis can bottom out on the track, again hindering traction. This loss of traction in both scenarios can cause the chassis to skate and make it unpredictable and difficult to drive.
A second purpose of shocks and springs is to control the amount of understeer and oversteer (tightness and looseness) present in a chassis at particular parts of the track. While springs have an effect on the amount of weight on a corner and the ride heights of the car in the static state (sitting still), their contribution in the dynamic state is limited. This second purpose is where we need to spend some time…read on.
Shock Terminology
“Dampening” or “damping” means “to depress, reduce or lessen.” These terms can be used interchangeably. A shock reduces the amplitude of the wave the chassis creates after it hits a bump in the track. If a car had no shocks, it would oscillate for a long time.
Compression is when the shock gets shorter; rebound is when the shock gets longer. For example, when the front bumper is depressed, compression occurs, when it is released, the shocks rebound.
Velocity of a shock is the speed at which it is compressing or rebounding. Velocity is usually referred to in terms of inches per second or inches/second. Shocks have different dampening forces at different velocities.
Shock Dyno Graph
The dampening forces of shocks at different velocities may be analyzed on a shock dyno. Hyper’s Roehrig shock dynamometer is the best in the business. The dyno has a load cell at the top that very accurately measures the forces of the shock as a servo motor turns a crank that oscillates the shock. The servo motor can spin very accurately at different speeds enabling recording of the forces at high and low velocities. A graph of these forces, known as a velocity vs. force graph, can be created. There are other graphs that can be viewed, but this is the most common.
Figure 1: This graph shows velocity in inches per second on the X axis (horizontal) and force in pounds on the Y axis (vertical). The negative numbers (lower part of the graph) appear when the shock is in rebound, and the positive numbers are compression.
Figure 2: The multiple lines on the negative side of Figure 2 represent each turn of the shock adjuster of this adjustable rebound or “tie down” shock. In this case each line represents one turn change on the shock adjuster knob.
Figure 3: This is an adjustable compression shock.
Be careful when reading a shock dyno graph, since not all software will print the graphs the same. Some shock builders prefer the rebound side of the graph to be on the top and the compression on the bottom. (This is the way ARS prints out their graphs.) Hyper Racing on the other hand, prints them out as you see here, with the rebound on the bottom. It really makes no difference. Just look for the negative numbers and that is the rebound side. Engineers are taught that the negative numbers run down the page and positive numbers go up the page, so this just looks right to me.
Pay attention to the scale of the graph, since the scale can make the graph look completely different. Notice the highest velocity (X scale, notations running along the bottom of the page) and the highest force (Y scale, the notations going up the side of the page).
Shock Number Rating System
Almost all shock companies use the force dampening at 3 inches/second velocity to rate their shocks and to apply a valving number to that shock.
Below is a chart that Advanced Racing Suspensions (ARS) uses to rate their shocks. It gives a general idea of what forces a particular shock will yield at 3 inches/second. It should only be used as a guideline.
The adjustable compression shock graph in Figure 3 is a 5/6.5-1, which is a 5 rebound with a 6.5 to 1 adjustable compression valved shock.
The shock valving number only describes the 3 inches/second number and nothing else. This number really has to be taken with a grain of salt because it totally ignores everything else about the shock dampening curve. It is a simple, easy to understand way of describing a shock.
Weight Transfer Due to Shock Force
To understand how the shocks affect car handling, read the article called Rethink Dirt: Advanced Dirt Track Theory.
How do rebound and compression damping forces influence the amount of weight on a corner? Every time the car moves as a result of a bump, wing force, or G force from lateral or longitudinal acceleration, the shock will influence the weight transfer on that corner of the car. In almost all cases the force from the shocks is much greater than the force from the spring and it will control more weight than the static weight.
If we add more rebound damping force to a shock on a particular corner of a car it will cause that corner of the car to have less weight on it when that shock is in the rebound state.
Conversely, if we reduce rebound it will place more weight on that corner when in rebound. This is fact and is documented in every notable shock book. Yes, this means when you add rebound damping force to your left rear shock, it is going to give the car less left rear weight.
Think in corners, here. For example, when adding rebound to the left front, add left rear-right front weight when the left front shock is in the rebound state. This will tighten the car in the lateral considerations, but may loosen the car for longitudinal acceleration due to the fact that it is going to keep the CGH lower. Go through these thought processes when making a change. It is rarely straightforward, one change will have many consequences.
More compression damping force of a shock will cause that corner of the car to have more weight on it while that corner is in the compression state. Less compression will place less weight on that corner when it is in compression.
Use this knowledge along with knowing how the car moves through a turn in the winged down phase and the roll right phase to figure out how the shocks are influencing the car's ride height and corner weight. Remember, it is only the center of gravity height (CGH) and tire loading, (trying to keep the weight equal on the rear tires), that is being affected here. All adjustments come down to this.
The shock dyno graphs show that the faster a shock is moving the more force it is applying. Hyper Racing's extensive real world testing with data acquisition units that sample the shock's position 1000 times per second, shows that shocks contribute a lot more to the corners weight when in motion than turns in a torsion bar stop or coil over adjuster nut.
For example: If Figure 2 is the graph of the left rear shock and the shock potentiometer shows that it is moving out (rebounding) at 2 inches/second at a particular part of the turn. The adjustment is set at full stiff (6 valving). The shock graph shows that the left rear corner of the car now has 150 pounds less weight on it than it did when the car was at rest. If the shock had been set at full soft (2), it would have only 30 pounds less weight on it. That is a 120 pound difference in weight. Considering that one turn on the torsion bar on the left rear would only change that corner's weight by about 5 pounds. This is a pretty large change.
Data Acquisition
The Motec SDL3 data acquisition system with shock potentiometers has been used extensively by Mike Dicely at Hyper Racing for shock research and development. These shock sensors measure the position of the shock up to 1000 times per second. It also measures the lateral, longitudinal, and vertical G forces, speed, GPS track mapping, steering position, and yaw rate. In addition, the Motec SDL3 has many engine sensors that have nothing to do with suspension or our discussion here.
The real power of the Motec system is in its i2 Pro software. Without the software all you have is a bunch of numbers. The software allows you to plot graphs, create math calculation channels based on sensor data, look at the line you drove around the track, and lots of other really cool stuff.
At first, Mike just collected data, asked a lot of questions, read a lot of books, and consulted some really smart race engineers. These engineers, who collect, analyze and solve high end asphalt race car data problems for a living, were amazed and curious at the data that came off of winged dirt cars. It was something they had never seen before and it challenged them to think differently than they normally do. The huge top wings and yaw angle (the angle through the turn) are unique in the racing world.
Real Life Shock Velocities
With a data system and shock sensors we are able to record real life on-track shock position and use it to write a math channel to calculate the velocities of the shocks by taking the derivative of the position over time. All velocities in this paper are represented in inches per second (inches/second). Here is a graph from the i2 software showing each corner and its shock velocity.
Figure 4: Toward the left of the Figure 4 graph where the velocities are reaching some high numbers is during corner entry. This is a very transitional stage and the shocks contribute significantly in this phase of the turn. This particular data is from a really smooth 1/4 mile track.
Figure 5: The above Figure 5 graph is from a 1/6 mile rougher track. Note the difference in velocities. On the right it shows each corner's max velocity achieved in compression and rebound during this one lap. Numbers have been seen in the 40’s.
Shock Histograms
Figure 6: Smooth Track Histogram
Figure 7: Rough Track Histogram
A shock histogram shows the percentage of time the shock spends at each velocity (a history of its velocity on paper…histogram…kind of funny). Velocity is across the bottom, and percentage is on the left. Figure 6 is from a smooth slick track. When the shocks are valved incorrectly the histogram looks radically different and does not have the preferred normal distribution and bell shaped curve you see in this diagram.
The histogram has a light gray vertical area at 1-1/2 inches/second. This is called the low speed boundary. The low speed is what the driver feels and the high speed is what affects the chassis when it hits a bump. On asphalt, 1 inches/second or even 1/2 is used for low speed boundaries. On dirt this is too low and 1-1/2 or 2 is a better number to use. This is due to the roughness of the track and the fact that shocks are tuned many times for platform control (chassis attitude or the car's position). Since the car is racing in a circle and symmetry is not needed in our setup, the car is offset to the right.
The top histogram is from a slick track and the shock had more compression in the right front (FR), more rebound in the left front (FL) and low compression in the right rear. Look at the low speed % time. Note the use of "FR" for right front because that is how the Motec graph and F1 race engineers reference it. Most likely, that notation started in Europe where their language puts the noun first, then the verb. “The yellow car” becomes “the car yellow”.
A majority of the shock's time is spent in the 1 and 2 inches/second and these parts of the shock dyno graph are most important for what the driver feels. The percent of time the shock spends in rebound and compression above and below the low speed boundary is shown on the graphs across the top of each corner of the car. The high velocities (6 to 40 inches/second) are mainly achieved when the chassis hits bumps. Observing the velocity plot shows that on corner entry, the LF and LR see some pretty high numbers due to the winged down effect. This effect is much higher on slick tracks than on wet tracks.
When we change the valving on the shocks, the histograms change significantly. Many hours have been spent revalving shocks to get the histograms to look the way they do in these graphs. With previous shocks, the histogram of the front shock looked flat, since the low speed valving was way off.
Histograms are what all the advanced asphalt teams look to when they tune their shocks. This in combination with driver input are what is used to achieve the lowest lap times.
Shock Position
A plot of each corner's shock position is very useful to look at as it shows how the car is moving and when each shock is generally in compression or rebound. Before we look at these graphs, realize that, we race on dirt where conditions change all the time, we race on many different shaped tracks, the amount of traction in the track can be drastically different from top to bottom, we sometimes bounce off curbs and berms, and each driver has his own style. These variables lead to position graphs that make it very hard to derive any generalizations. I have spent countless hours staring at these position graphs trying to come to some sort of true statements that I can make about what ours cars do and when.
Here are some generalizations that can be made (with wings on).
Winged Down:
- On a wet track the car rolls left (wings down) on entry very little if at all. On a slick track the winged down amount and length of time in that phase is much larger.
- On tracks with long straights relative to the radius of the corner, the winged down effect is much larger than on tracks that are shaped like a circle.
- A higher wing (overall height, not just the back height) creates more winged down.
- On larger tracks, where the car is traveling much faster on corner entry; the winged down effect is higher.
- On tracks with long straights tight turns, the roll right transition is completed half way through the turn, after which the car stays in its rolled right state until the car begins to straighten out when it then begins to come back left again.
- On circle shaped tracks the car is in the rolled right state for a much longer time.
- There is not any front end lift on corner exit during a normal turn; the pitch of the car stays the same on corner exit. The left front is already up at the midway point, then yes the right front does come up as the car straightens out and the lateral G force is reduced, but so does the right rear, so the total pitch is about the same. If the driver lifts off the throttle for some reason the front will drop, then lift again when the throttle is applied. In a micro sprint, this happens very rarely because the driver is on the gas so much.
- The wing down force and side panel force has a big effect on the pitch of the chassis. Higher speeds and more yaw angle (car sliding), the more the rear of the car squats.
- Braking has a huge effect on pitch. When the brakes are applied, the front end drops drastically. When the driver gets off the throttle, the engine has a large braking force applied to the chassis. This in turn drops the nose of the car. On entry if the driver lifts, the nose drops a lot. This is why the car turns in so much easier if the driver lifts. The weight is shifted to the front enabling the front end to have more traction.
- After the car achieves its full roll right state, which usually happens about half way through the turn, the shocks maintain their position until the driver begins to straighten it out for the straight. You will still see a lot of movement in the shocks but it is all from bumps in the tracks surface.
- Since the shocks' general position does not change after the car reaches its rolled right state, does this mean the shocks have no effect on the car? No, but it does mean their effect is definitely reduced. On a smooth track, it could be argued that they don’t have any effect, but that is almost never the case. There is an effect called “trending” which happens as the car goes over even a small dip or bump. If the shock has stiff compression and soft rebound, that corner will begin to “trend” up or its position will be higher than before it hit the bump for a certain time. If the bumps/dips occur repeatedly, the effect is continuous. If a shock has stiffer rebound than compression, it will begin to trend down as that corner encounters bumps. On a dirt track where the track is never smooth and always has some sort of ripples or imperfection in it, the easy up (more compression than rebound) or tie down (more rebound than compression) shocks will influence that corner's dynamic (in motion) ride height and therefore the weight on that corner. The greater the difference in rebound and compression damping force, the greater that influence will be.
- This effect can be seen easily on a chassis that has a high amount of rebound on the left rear. As that car travels down a straight, the left rear will trend down. Usually then, on corner entry, when the winged down effect happens, the chassis will normally bottom out.
- This trending effect can happen on any corner of the car and can be used to help the chassis…or hurt it.
Figure 8: Position data from an 1/8 mile track.
Figure 9: Data from a 1/3 mile track with tight turns and a long straightaway.
The top 4 lines are the positions of the 4 shocks. Green is the RR, Pink RL, Red FR, and Gold FL. The next group of lines down shows the lateral roll angle of the car. As the car rolls right, the line moves down. The roll angle is a simple math channel written based on the shock position and a few known static measurements. The next line down is the pitch (front to back roll). The lower the line the more rolled to the rear the car is. The bottom group is the g-force, lateral and longitudinal.
Figure 9 shows how much the car rolls left on the bigger track, and for how much longer. It wings left so much that the right front shock is topped out.
Using the shock dyno graph, shock position, g-forces, many static measurements, and formulas, math channels can be written to calculate the weight on each wheel as the car takes a lap. It’s pretty amazing and revealing.
Monotube Vs. Twintube
Monotube shocks are also incorrectly known as gas shocks. Both monotube and twin tube shocks use gas pressure. Monotube shocks use high pressure gas (nitrogen) on the opposite side of a floating piston to keep a constant pressure and volume of oil in the shock body as the shaft adds and subtracts volume when the shock oscillates. Twin tube shocks use a lower pressure gas in a bag to achieve the same result. Monotube shocks have an advantage of control, since their larger pistons displace more oil for a given stroke. This is especially true for the rebound stroke. The greater the amount of oil moving through a shock's piston, the easier it becomes to regulate the flow and thus control the damping forces of the shock. Although fading is generally not a problem for micro sprints, monotube shocks also will not fade due to heat. They stay cooler because the piston and oil are in direct contact with the outside wall of the cylinder allowing for better dissipation of heat. Monotube shocks also last longer because they have less moving parts to wear out.
- Twin tube shocks use a rupture-prone gas bag to hold the nitrogen. When this bag breaks the nitrogen mixes with the oil making the shock skip as the gas moves through the piston orifices. Bubbling noise can be heard when the shock is actuated by hand. In contrast, an advantage for twin tube shocks is they can still function properly with small dents in the housing because of the use of their inner cylinder.
- Rod pressure is the amount of force that pushes the shaft of the shock out. Rod pressure is undesirable because it essentially increases spring rate. This makes the car feel like it is on top of the race track. An advantage of twin tube shocks is that they have less rod pressure due to the smaller piston and the lower gas pressure. ARS monotube shocks use a unique foot valve to virtually eliminate rod pressure, this is a huge advantage to using ARS monotubes.
- Whether you choose the high performance monotube or the economical twin tube shock, remember that it is much more important to select the correctly valved shock for your car.
The nitrogen gas pressure in a monotube shock is required at all times for it to function properly. 2009 and newer style ARS shocks with the S designation after the shock number require very little gas pressure. The gas pressure can be adjusted to suit various track conditions. Changing gas pressure affects the car in a manner that is like increasing ride height or adding turns to that corner. It is not at all like going to a stiffer spring rate/torsion bar size. You can think of it as though adding 80 psi is like adding 10 pounds to that corner, or like adding two turns on that torsion bar. I have done tests and, at least on the ARS shocks, adding gas pressure does not make a spring rate type change, it only adds rod pressure.
Less pressure on the right rear shock will tighten the car in the middle of the corner. Increasing the pressure right front or left rear shocks will provide more cross weight (RF + LR) to the car providing more bite in the middle and out. Adding pressure to all the shocks equally will raise the whole car, raising the center of gravity which will provide more forward bite.
Setting Gas Pressures
The pressure in the ARS monotube shocks can be adjusted from 10 psi to 100 psi. To start, set the front shocks at 20 psi and the rear shocks at 10 psi.
- Back the wing nut off all the way on the inflation unit before screwing it on the Schrader valve of the shock.
- Tighten the hex nut coupler onto the valve of the shock.
- Screw the wing nut all the way clockwise so it opens up the shock valve.
- Pressurize the shock to the desired pressure using nitrogen gas only.
- Screw the wing nut counterclockwise all the way to seal the shock valve.
- Gas pressure can be heard escaping from the shock as the inflation unit is removed.
- 5 to 7 psi will be lost every time the inflation unit is applied to the shock.
Advanced Racing Suspensions (ARS) shocks contain the highest quality components for maximum performance. Hyper Racing is the world’s largest distributor of ARS Shocks. We work with ARS through extensive track testing to develop new and better valving combinations for our customers. Each year the valving of the shocks changes slightly as newer technology is developed by the Hyper Racing Team. Please check the setup pages to view the latest shock valving recommendations.
Building a Quality Shock
ARS dynos every shock built and allows no overlap in valving numbers, maintaining the tightest tolerances in the industry. ARS removes all air and pressurizes the shock properly avoiding cavitation. Each twintube valve is individually flow tested to ensure consistent dampening. The 3200 ARS series (mono tube) shock utilizes a base valve installed between the floating piston and the valving piston to isolate the pressure, allowing for substantial reduction in rod pressure. Maximum traction is obtained because pressure build up is dramatically reduced with the use of the low rod pressure. The base valve design requires so little gas pressure that certain valvings have only 3 lbs. of rod pressure. This low rod pressure creates more driver feel which is lost in many high pressure shocks. The 3200 series shock will accept gas pressure from 10 lbs. to 100 lbs. which provides for fine tuning the chassis balance with gas pressure. The latest base valve designs have a feature that helps to eliminate hysteresis. Hysteresis is the residual forces in the shock as it changes direction. The bottom line is it really helps shocks control the car on a rough track.